• Explore Categories
    • Living Planet
    • People & Patterns
    • Natural Wonders
    • Odds & Ends
    • Behind the Map
Subscribe
Search Form
No Result
View More Search Results

Can Maps Improve Your Golf Game?

by Robby Deming
April 4, 2024
Odds & Ends
Map of golf course with shots from a round overlaid on it.

Maps are powerful because they help us find patterns and detect trends we may not otherwise see. From climate change to demographic shifts, maps help connect the what, why, and where. Those same capabilities that make maps an essential tool for understanding can also be applied to other pursuits. Like sports.

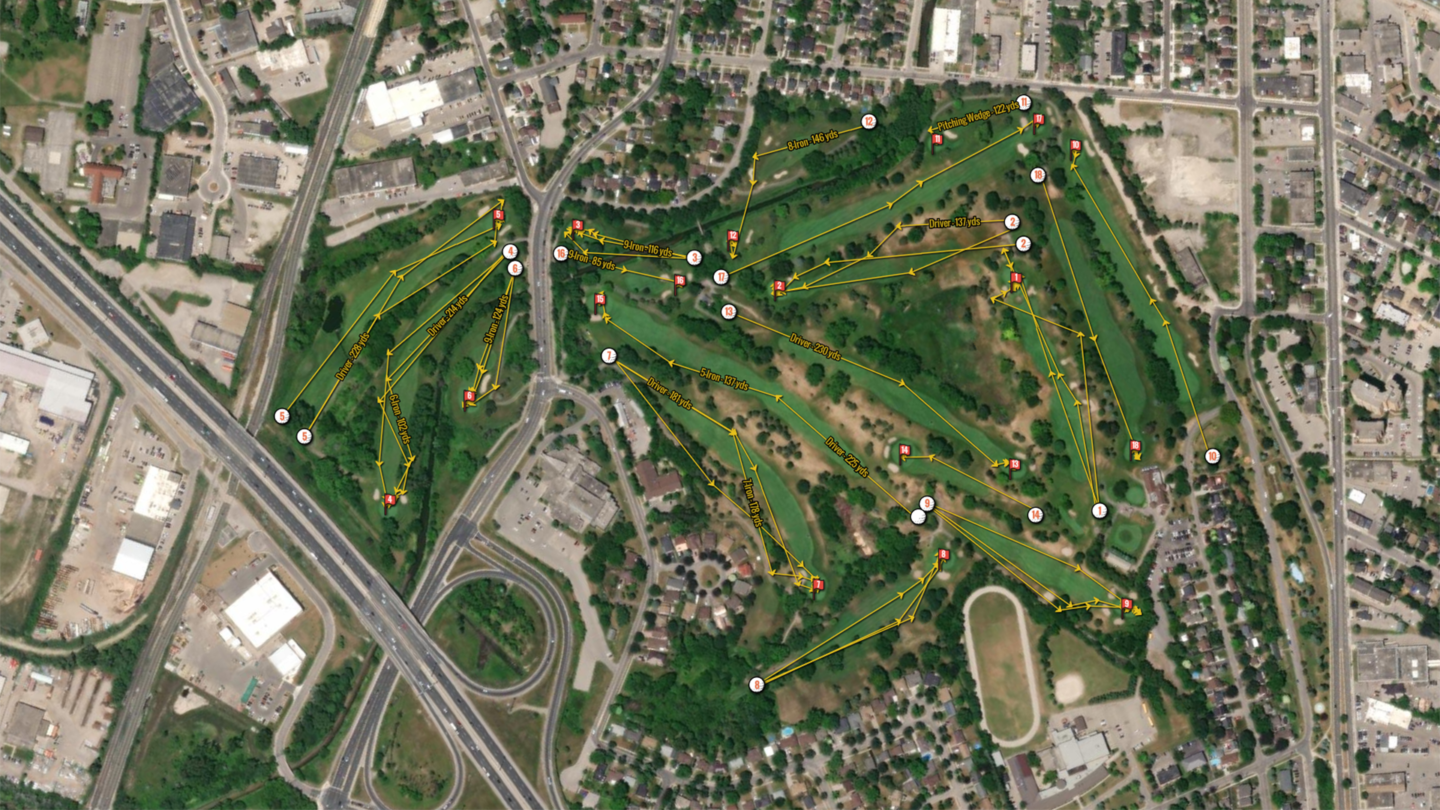
This interactive map from Warren Davison at Esri does just that. Warren brings the power of geography to his golf game by meticulously recording and charting shots over a summer of rounds at his local courses.

Map of golf course with shots plotted on it.

Divots and Dashboards

See how mapping shots can reveal ways to improve your golf game.

Explore Interactive Map

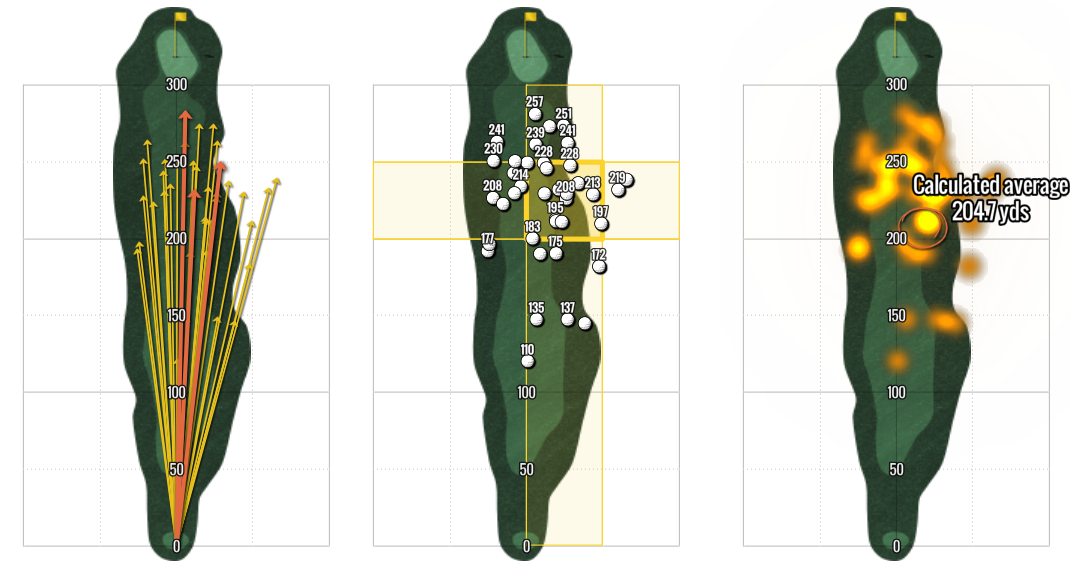
The map includes a series of visualizations that provide insights into his game. There are views showing every shot from every round. An interactive chart shows the distribution of shots by club, and a filtered heat map reveals the average distance and landing location of tee shots from a driver.

Golf map asset
Mapping drives from the tee shows patterns in Warren’s play. (Source: Esri)

By mapping his game, Warren uncovers a key insight: he needs to aim further left on his drives. Maps provide an objective canvas for athletes to measure and diagnose their play. From basketball to tennis, maps can uncover tendencies and behaviors that athletes (and their competition) can use to gain advantages and win.

By The Numbers

515

Shots analyzed in the map.

204.7

Average length in yards of tee shots taken with a driver.

29.7K

Aggregate yards travelled by all shots.

About This Map

Title
Divots and Dashboards
Creator
Warren Davison, Esri
Data Sources

Recorded data from golf rounds

Tags
Interactive Sports
Share This Article

Keep Exploring

The US faces many natural disasters, the type of which varies by location.

Back to the Map: The United States of Natural Disasters

July 21, 2025
Behind the Map
Back to the Map Climate Change Disasters
Photo of Austrian Alps.

Back to the Map: Avalanche Risk in Dachstein Area

June 10, 2025
Behind the Map
Back to the Map Snow
Screenshot of ArcGIS Pro showing a work-in-progress image for Map Turtles Mapped.

Back to the Map: Map Turtles Mapped

January 16, 2025
Behind the Map
Back to the Map Conservation
View More Maps
Next Post
Article heat dot gov embed preview

Where Is Heat Becoming More Extreme in the US?

April 4, 2024 Living Planet

Maps.com
Explore Today.
Create Tomorrow.
  • About Maps.com
  • Submit a Map
  • Contact
  • Legal
  • Privacy
  • Media Use
  • Manage Cookies
  • Do Not Share My Personal Information
  • Legal
  • Privacy
  • Media Use
  • Manage Cookies
  • Do Not Share My Personal Information
  • Categories
    • Living Planet
    • People & Patterns
    • Natural Wonders
    • Odds & Ends
    • Behind the Map
  • About
  • Submit Map
  • Contact Us
Subscribe

  • Legal
  • Privacy
  • Media Use
  • Manage Cookies
  • Do Not Share My Personal Information

Add New Playlist

  • Categories
    • Living Planet
    • People & Patterns
    • Natural Wonders
    • Odds & Ends
    • Behind the Map
  • About
  • Submit Map
  • Contact Us
Subscribe

  • Legal
  • Privacy
  • Media Use
  • Manage Cookies
  • Do Not Share My Personal Information
Divots and Dashboards

Thank you!

We have received your request and will send updates about Maps.com to your email:

Continue reading article

Sign Up For Updates

Skip to content