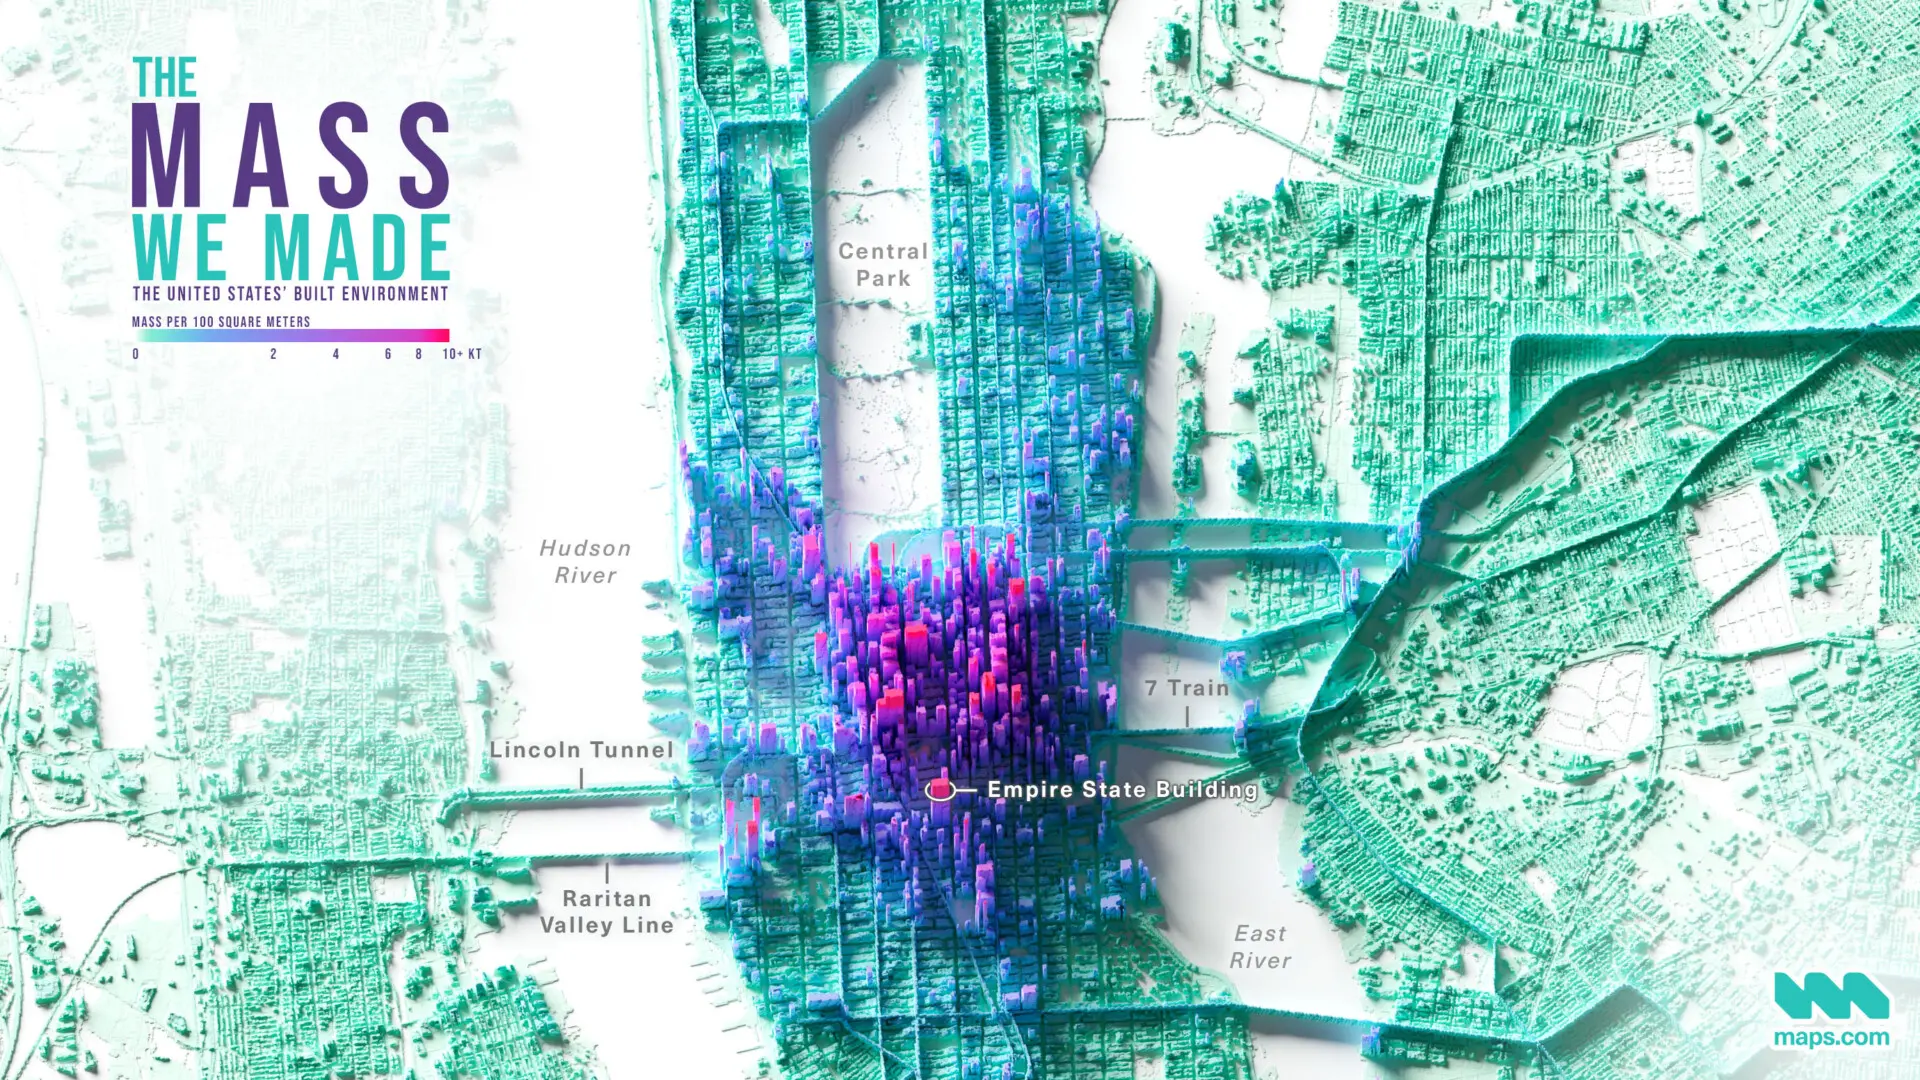
The mass of a structure is influenced by both its size and material. Underground construction, like tunnels, is included in this analysis. (Source: Maps.com)
The United States of America has been called a land of plenty. This often refers to ideas of freedom and opportunity, but it is also true in more physical, tangible ways. The US is home to more than 330 million people, a number that has doubled since the 1950s. In 2023, the US economy—the largest in the world in nominal GDP—reached $27 trillion. All these people, their homes, the work they do, and the products they trade, rely on an ever-expanding infrastructure. That infrastructure requires mass. And plenty of it.
From roads, bridges, buildings, and tunnels to houses, schools, pipelines, and wharfs, much of our landscape is a built environment. In terms of mass, the built environment in the US is 2.6 times larger than plant biomass in the country.
To determine these figures, a team of researchers used satellite imagery, transportation networks from OpenStreetMap, building footprints from Microsoft, and other geodata. Combining this analysis with material stock estimates produced a high-resolution (10 meters per pixel) inventory of the mass of the built environment. The data covers the entirety of the continental United States.
We used this analysis to produce the maps above and below. Color and vertical exaggeration are used to depict mass, rather than the true height of the environment. It is possible for structures low to the ground, or even underground, to have more mass than taller, less dense buildings. Regardless of their real-world height, features of lower mass gently rise from the map in shades of teal and blue. More massive structures tower over them in purple and magenta.
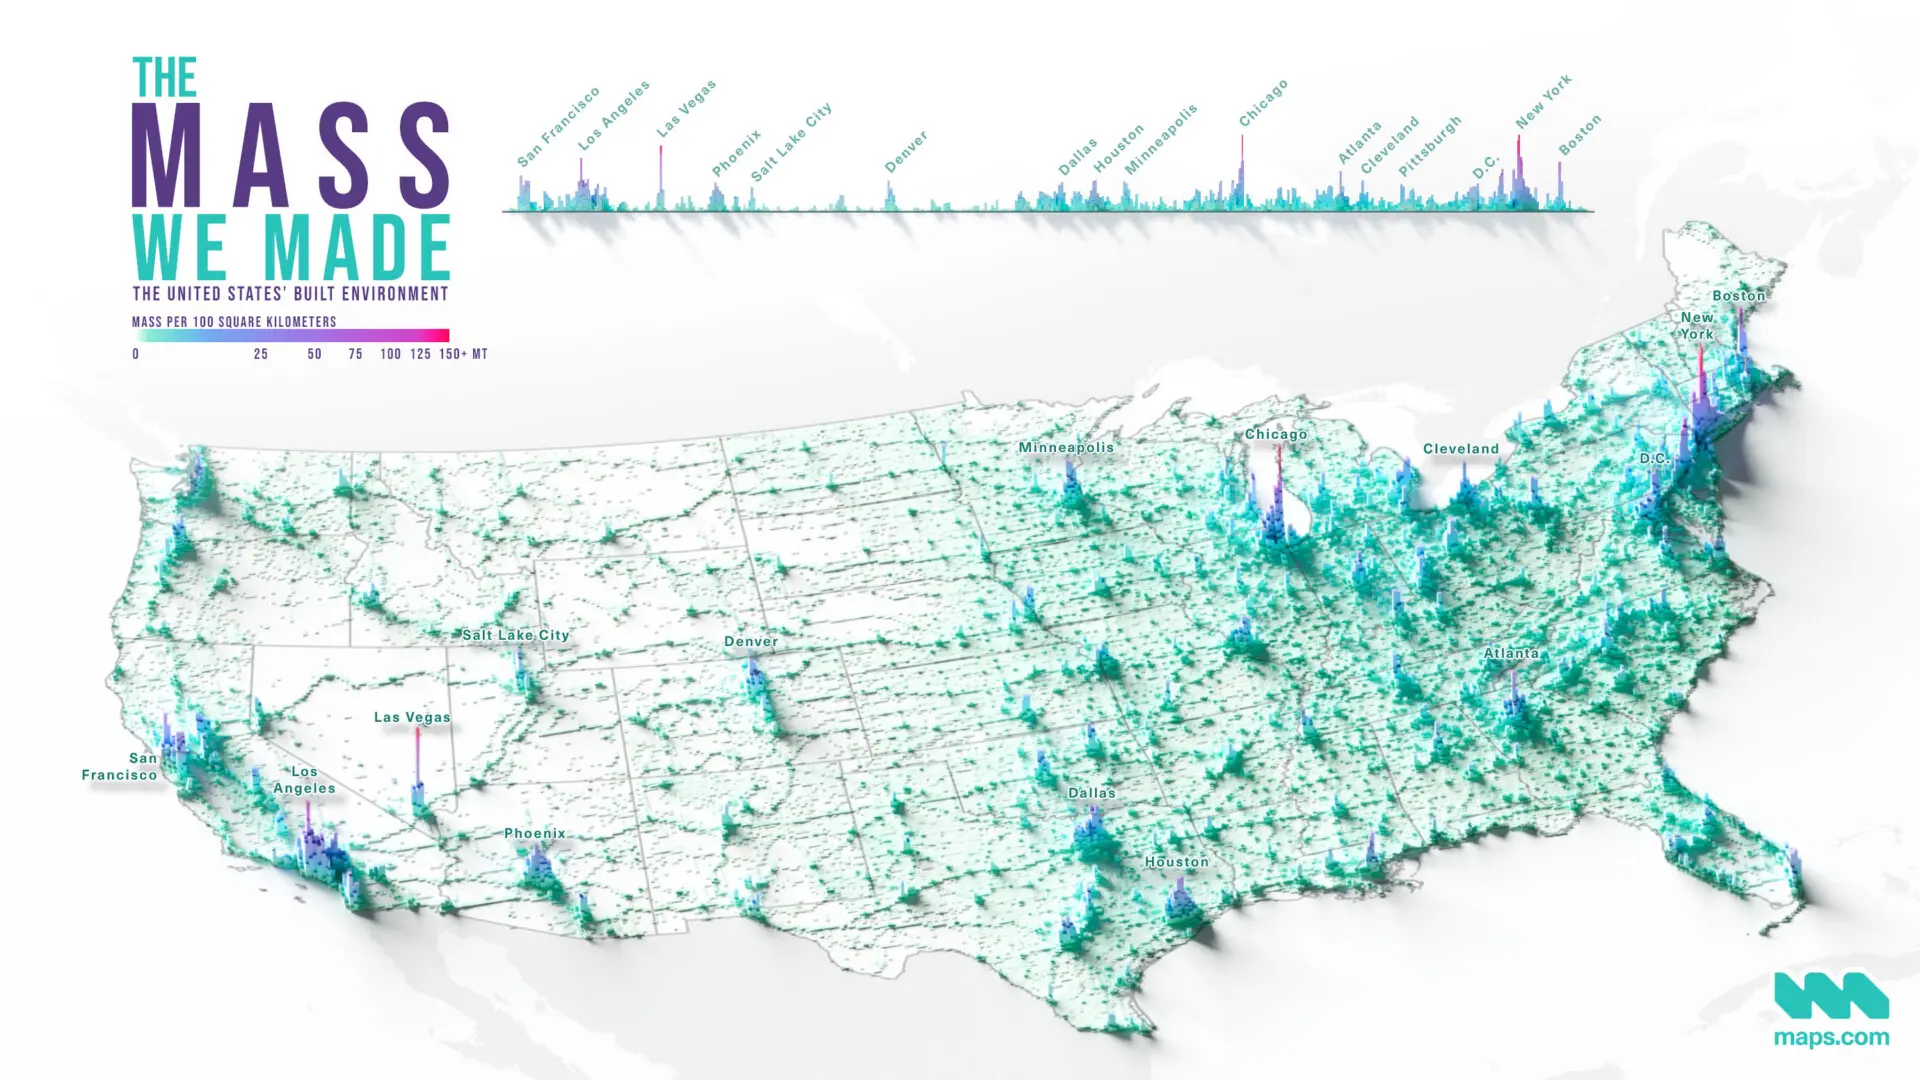
Some areas, like the East Coast, are dominated by buildings. Roads and highways account for much of the built environment in the Central US. (Source: Maps.com)
Beyond individual features at the neighborhood scale, the research team points out important differences across areas of the US. In the northeast and in pockets in the southeast, southwest, and northwest, buildings account for the most mass. But throughout much of the middle of the country, transportation and mobility networks outweigh buildings.
As the US and its infrastructure continue to grow, analysis like this helps us understand the weight of our actions and even how things change over time. Globally, the mass of the human-made environment has doubled about every 20 years and is now equal to the dry-matter equivalent of all biomass on Earth.
About This Map
Title
The Mass We Made: Mapping the Weight of the Built Environment