• Explore Categories
    • Living Planet
    • People & Patterns
    • Natural Wonders
    • Odds & Ends
    • Behind the Map
Subscribe
Search Form
No Result
View More Search Results

How Common Is Student Loan Debt in the US?

by Robby Deming
October 16, 2023 Over 2 years ago
People & Patterns

Canceling student debt is contentious. Opponents argue that relief would benefit elite, wealthier families. Supporters counter that student loan debt impacts millions of people across income ranges. This animated map reveals the reach of student loan debt and where the burden is highest.

The map from Esri explores student loan debt in two ways. You can see which states have the highest average student loan debt. The map also shows the share of people in each state with student loan debt.

Map of eastern United States focused on Maryland showing average student loan debt by state
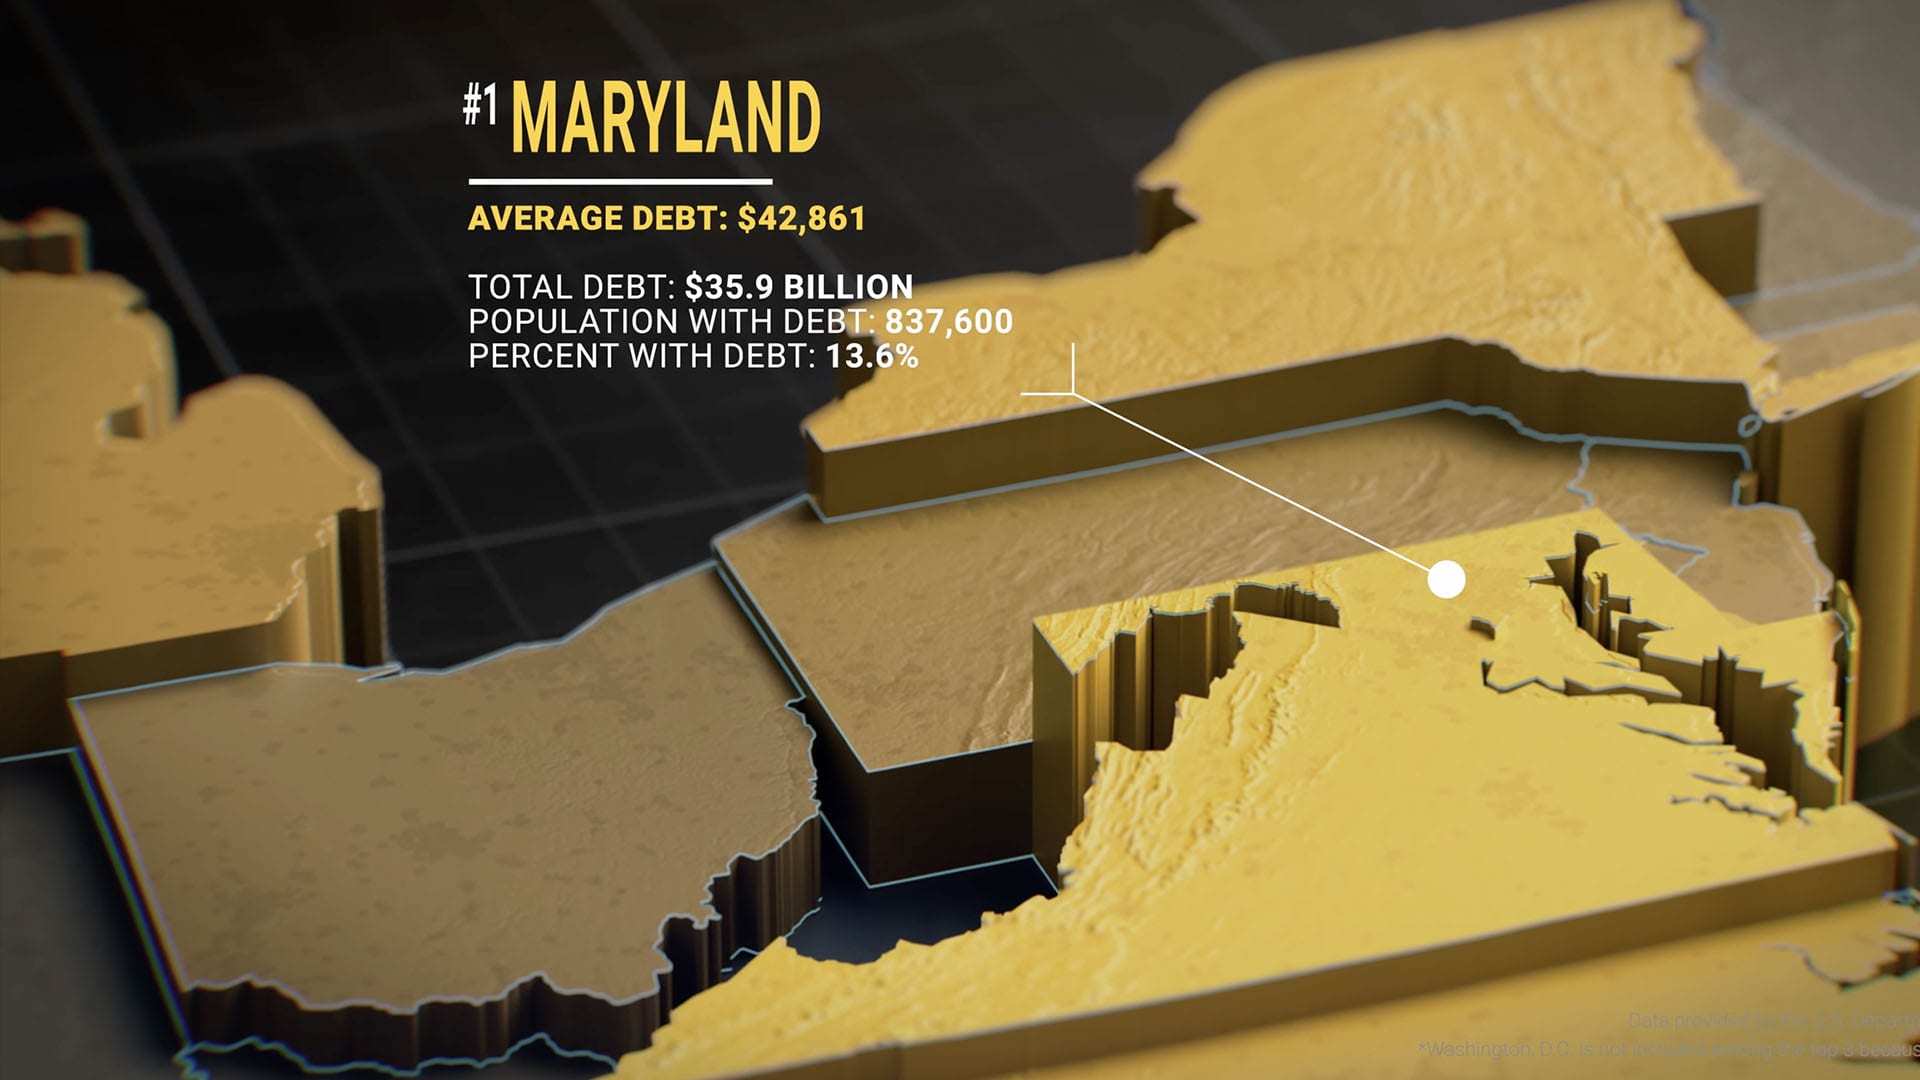
Maryland ranks #1 in the US for average student loan debt at $42,861. (Source: Esri)

Viewing student loan debt this way shows that it’s not a regional issue. In fact, the states that rank in the top 3 for each measure might surprise you.

This is the true power of maps—to help us see things in new ways. To find patterns. To understand something from a different angle. 

This map won’t end the debate about canceling student loan debt. But it does provide important context about the potential impacts of such a policy.

Map of southern United States focused on Georgia showing percent of population with student loans by state.
Georgia is a top 3 state for average student loan debt and share of population with student loan debt. (Source: Esri)

By the Numbers

$1.5 Trillion

Combined total student debt in the US.

$35,964

Average student loan debt in the US.

12.5

Percentage of Americans with student loan debt.

About This Map

Title
Animated Maps: Student Loan Debt in the United States
Creator
Esri
Data Sources

EducationData.org (as of April 3, 2022)

Tags
Animated Maps Education Student Loans
Share This Article

Keep Exploring

Map showing school districts symbolized by percentage of students of color.

How Do School District Boundaries Impact Students?

June 17, 2024
People & Patterns
Education Equity Explainer
Map of US showing locations of reported laser strikes on aircraft.

Where Are Aircraft Pilots Threatened by Laser Incidents?

April 11, 2024
People & Patterns
Animated Maps Historical Original
Map of the US showing in-state tuition at public colleges in 2023.

Where Is Tuition at Public Universities Rising the Fastest?

April 3, 2025
People & Patterns
Animated Maps Economy Education
View More Maps
Next Post
A map showing the contiguous United States and the paths of solar eclipses that will happen in 2023 and 2024.

NASA Maps Solar Eclipses of 2023 and 2024

October 16, 2023 Natural Wonders

Maps.com
Explore Today.
Create Tomorrow.
  • About Maps.com
  • Submit a Map
  • Contact
  • Legal
  • Privacy
  • Media Use
  • Manage Cookies
  • Do Not Share My Personal Information
  • Legal
  • Privacy
  • Media Use
  • Manage Cookies
  • Do Not Share My Personal Information
  • Categories
    • Living Planet
    • People & Patterns
    • Natural Wonders
    • Odds & Ends
    • Behind the Map
  • About
  • Submit Map
  • Contact Us
Subscribe

  • Legal
  • Privacy
  • Media Use
  • Manage Cookies
  • Do Not Share My Personal Information

Add New Playlist

  • Categories
    • Living Planet
    • People & Patterns
    • Natural Wonders
    • Odds & Ends
    • Behind the Map
  • About
  • Submit Map
  • Contact Us
Subscribe

  • Legal
  • Privacy
  • Media Use
  • Manage Cookies
  • Do Not Share My Personal Information

Thank you!

We have received your request and will send updates about Maps.com to your email:

Continue reading article

Sign Up For Updates

Skip to content