The Pacific Northwest is known for its cool, wet climate. But this is no drab and dreary landscape. It’s a volcanic region where both mountains and dense forests tower over more than 4,000 miles of coastlines, forming numerous fjords, straits, and islands. From its geography to its history and people, the Pacific Northwest is rich and diverse. And it is here that you will find the Salish Sea, an inland sea shared by the US state of Washington and the Canadian province of British Columbia.
Shown in a stunning new map by Dave Taylor, a cartographer and analyst with Pathfinder Geospatial, the forests of the Salish Sea bioregion receive plenty of rain. But not all areas see similar amounts of rainfall. Taylor’s map explores the relationship between rainfall and the height of forest canopies.
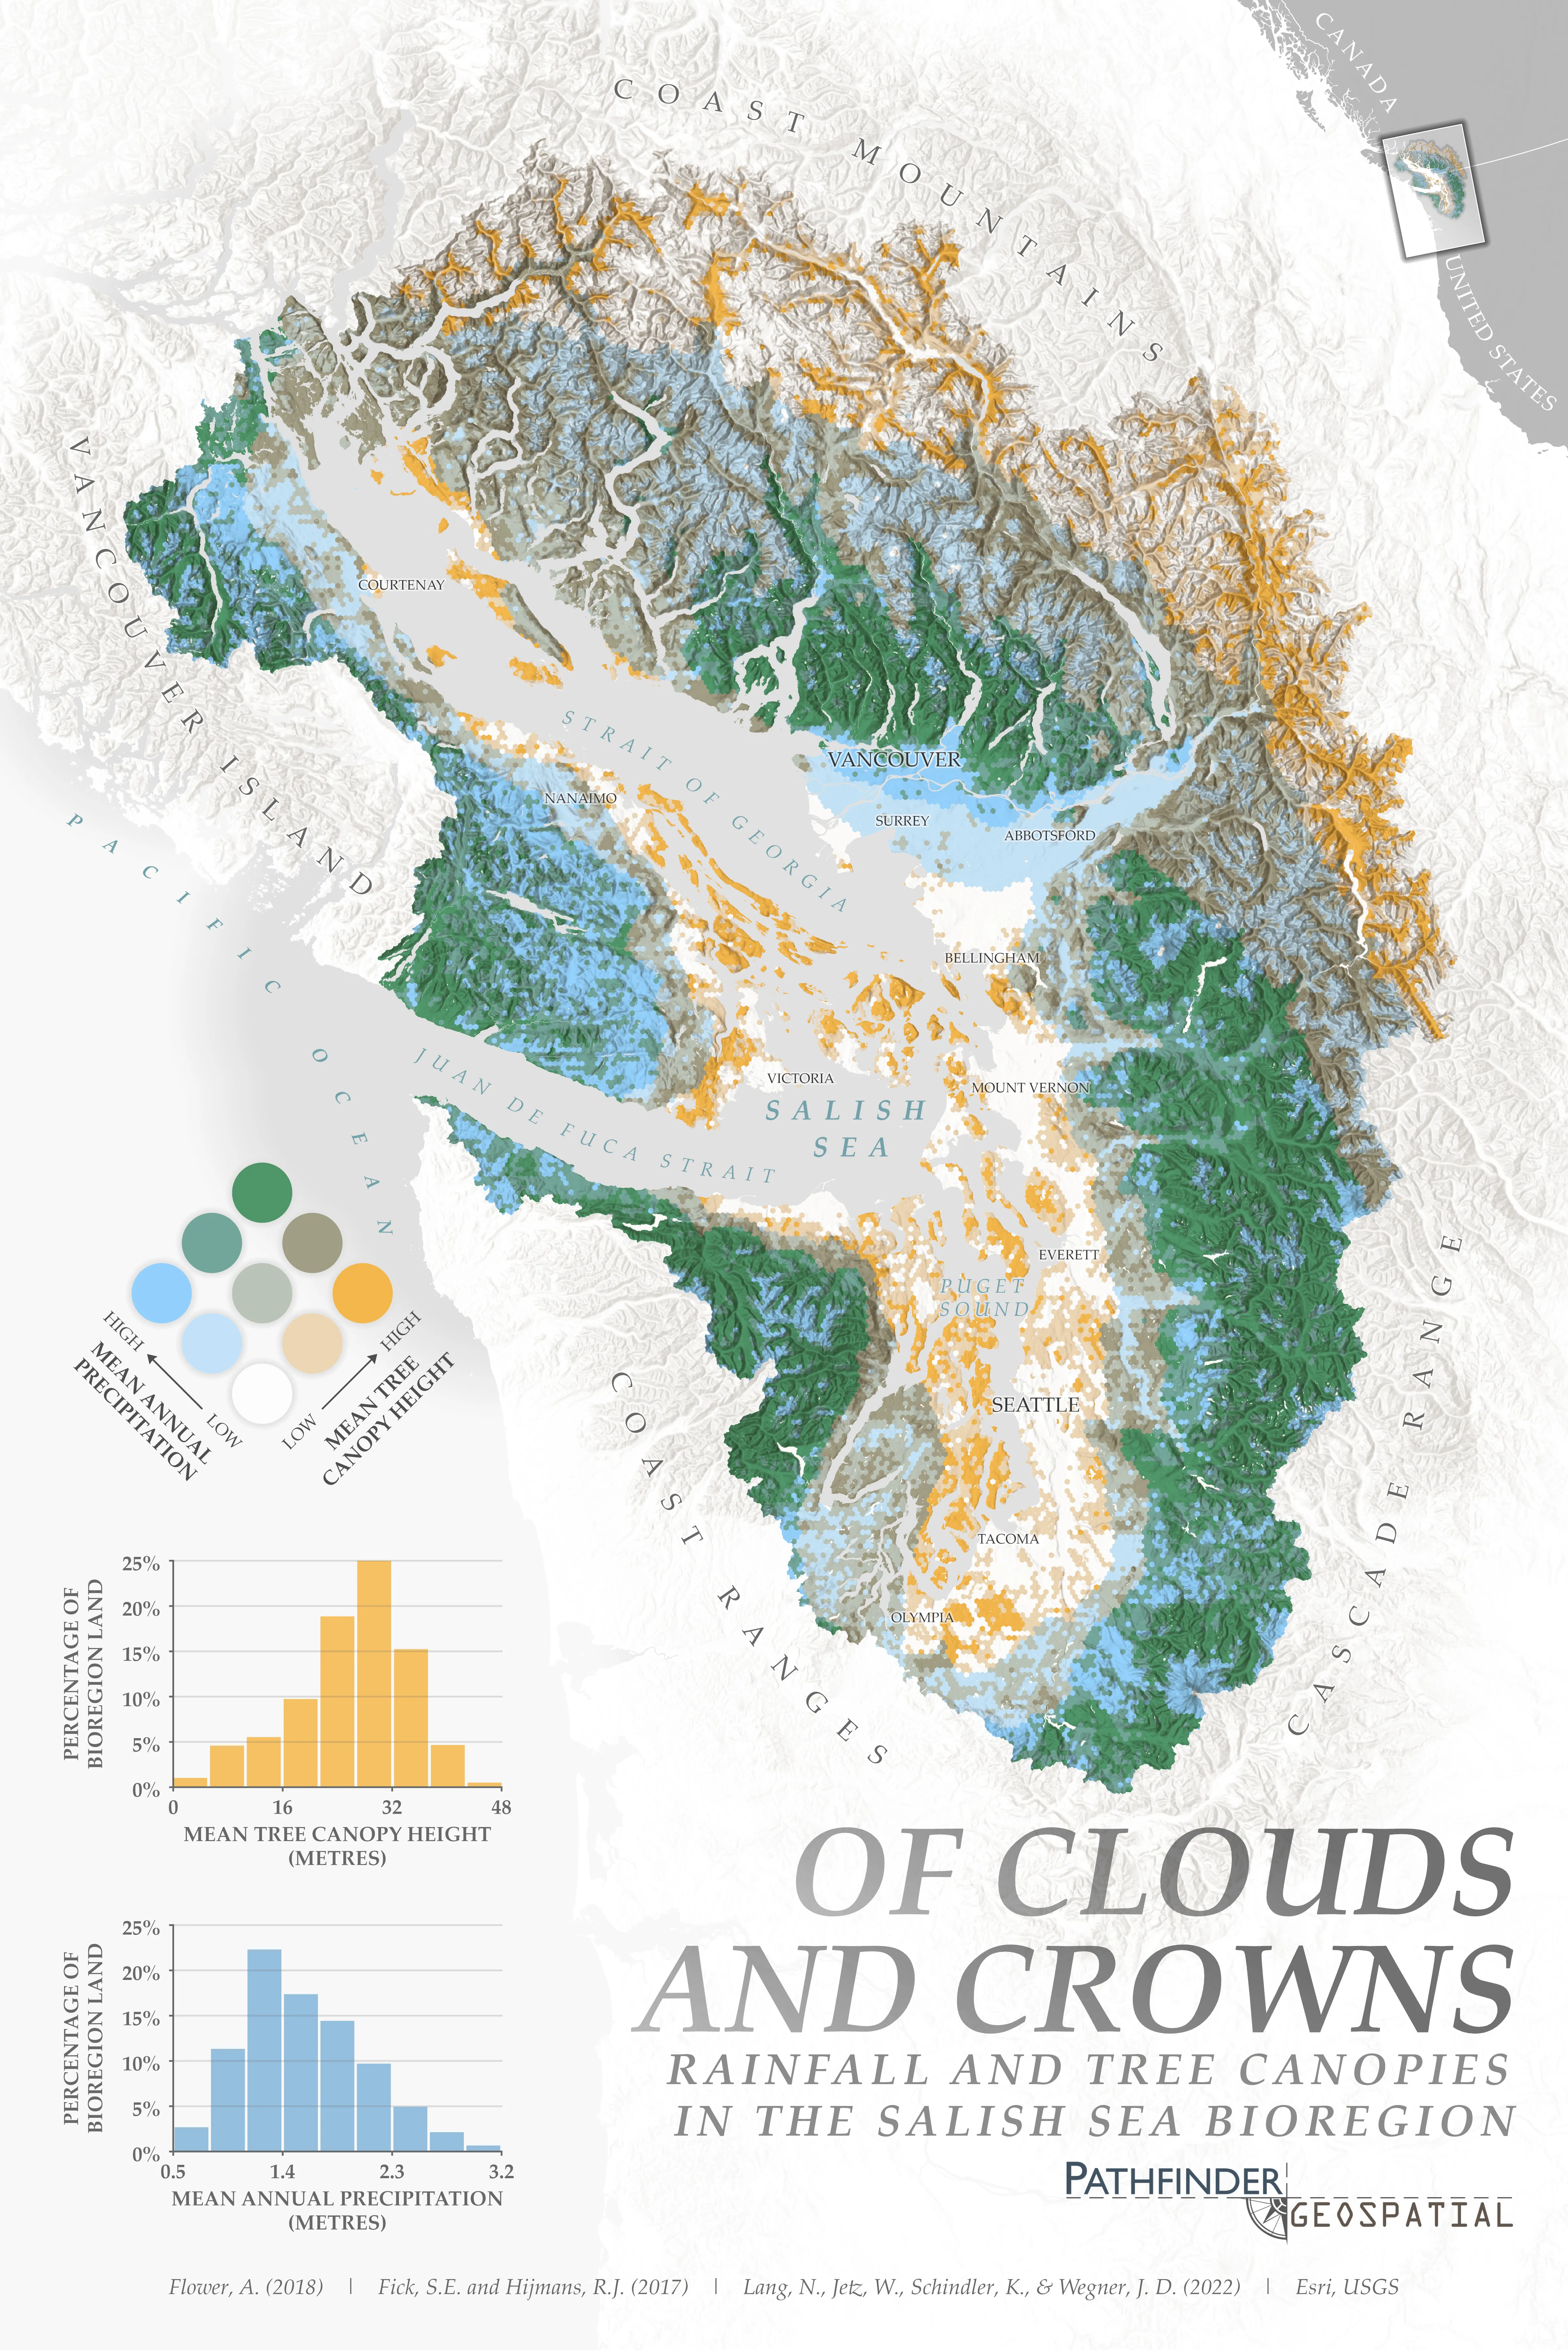
With a striking bivariate color scheme, Taylor’s map simultaneously shows rainfall amounts (white-to-blue) and tree canopy heights (white-to-yellow). Areas where both rainfall and canopy heights are high are shown in green. Bivariate color palettes can be challenging, especially for viewers with red-green colorblindness, which affects between five and ten percent of the population. But Taylor’s map expertly relies on blues, greens, and yellows without a strong red component, improving its accessibility.
Two inset graphics show the distribution of tree canopy heights and the average annual precipitation over the area. Reaching heights up to 48 meters (157 feet), much of the Salish Sea bioregion is covered by trees around 20 to 35 meters (66 to 115 feet) tall. Annual rainfall exceeds one meter (3.28 feet) across most of the mapped area, with some areas receiving as much as 3.2 meters (10 feet), or more, of precipitation each year.
Precipitation generally increases at higher altitudes, as wind pushes against the mountains surrounding the sea. Forced to rise, the air cools and encourages the formation of clouds and condensation. Most of the precipitation occurs during the months from October to April, which is when the jet stream drives storms and moisture inland and toward the mountains.
Taylor’s map beautifully shows the influence of increased precipitation on tree canopy heights at higher elevations, and especially near the windward side of the mountains. Just as the topography can produce a rain shadow effect on the leeward side of mountains, canopy height generally declines here as well. This relationship is not direct, however, and depends on tree species, forest age, land use patterns, and several other factors. Still, the environmental consequences of these weather patterns begin to emerge in the map.
Taylor’s cartography is as informative as it is gorgeous, begging the reader to learn more about the climate and geography of the Salish Sea.
About This Map
- Title
- Of Clouds and Crowns: Rainfall and Tree Canopies in the Salish Sea Bioregion
- Creator
- Dave Taylor, Pathfinder Geospatial
- Data Sources
This map was contributed through the Maps.com submission program. If you’d like your map to be featured, submit it for consideration.
- Tags