• Explore Categories
    • Living Planet
    • People & Patterns
    • Natural Wonders
    • Odds & Ends
    • Behind the Map
Subscribe
Search Form
No Result
View More Search Results

How Will Climate Change Accelerate High Tide Flooding in the US?

by Robby Deming
February 15, 2024
Living Planet

Sea level rise is now a reality for many coastal cities. Although these places aren’t permanently submerged, they do experience regular high tide flooding. Over time, models suggest these nuisance events will become persistent problems.

This interactive map from Esri projects high tide flooding for coastal cities through 2100. It uses data from the National Oceanic and Atmospheric Administration (NOAA) to show increases in annual flooding days.

Map focused on Virginia showing projected changes in flooding days. Launch Interactive Map

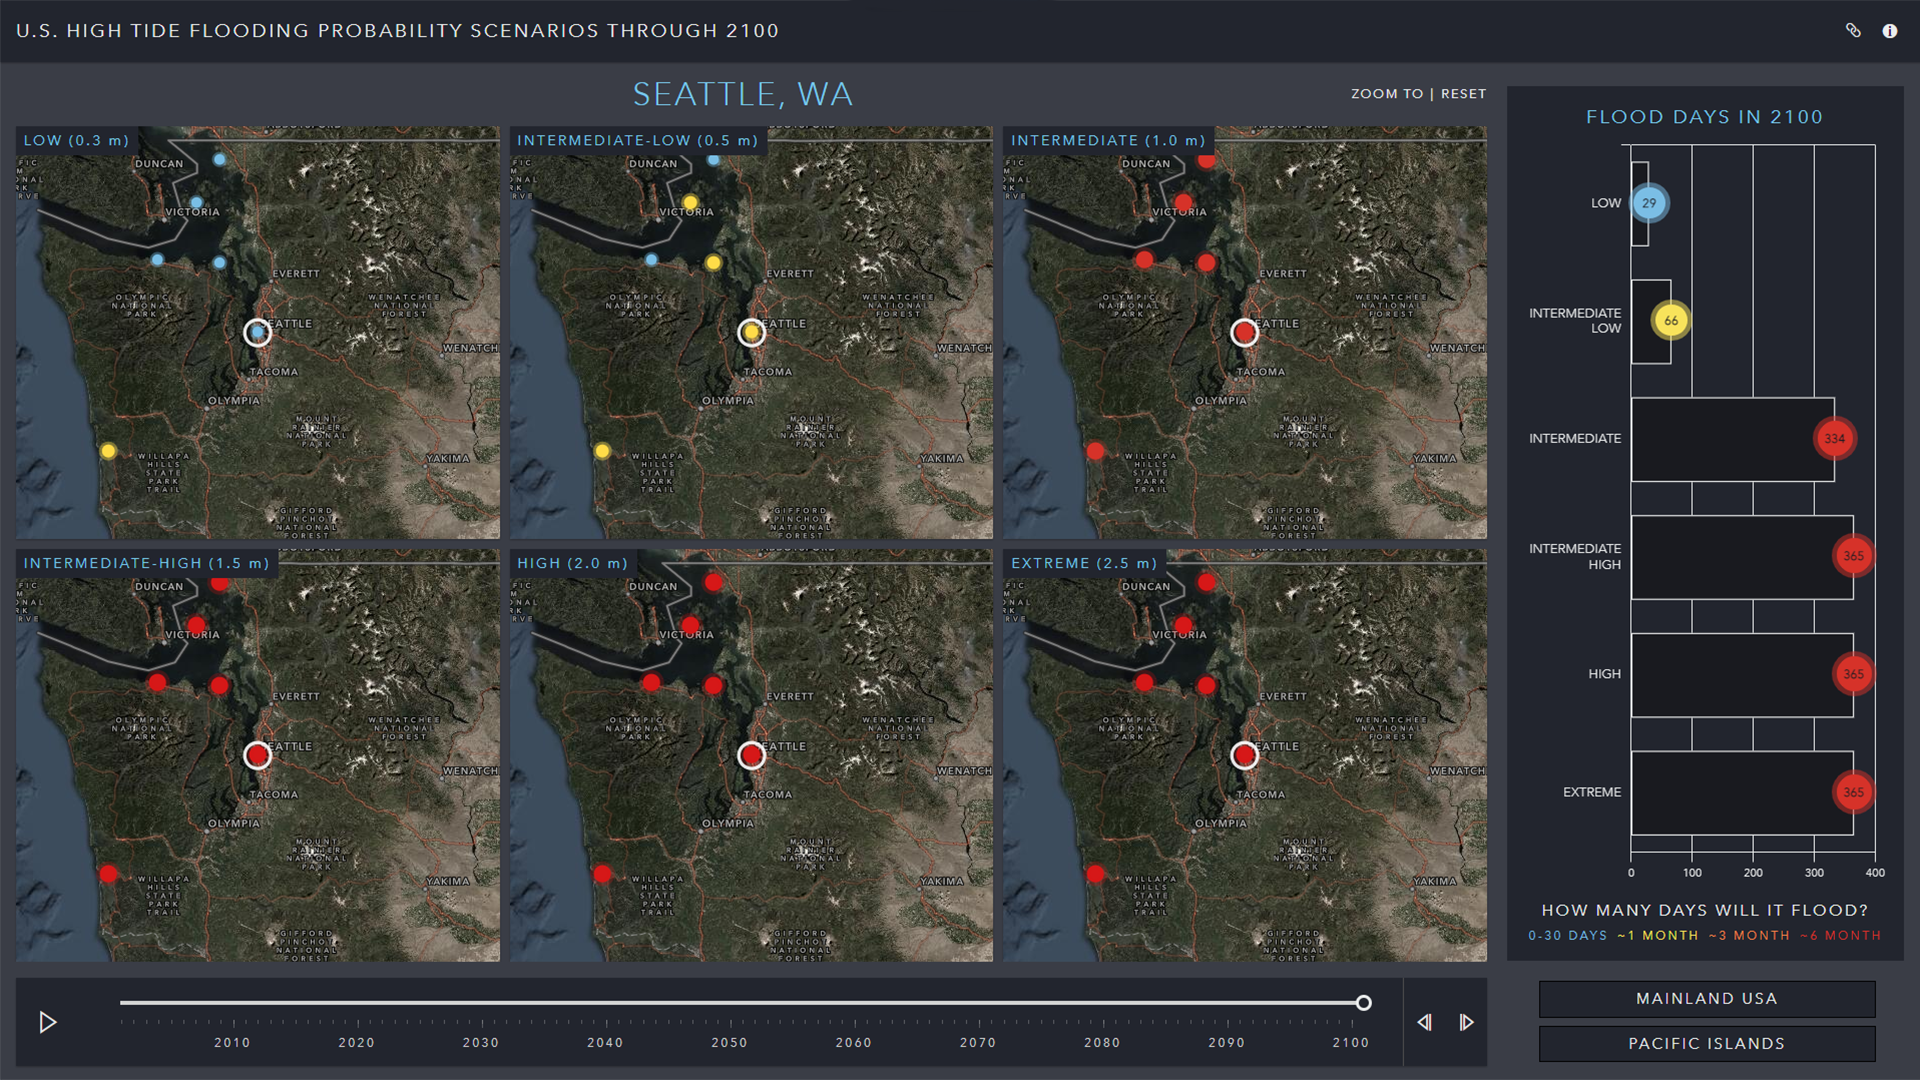
The map shows six different scenarios for sea level rise. They range from low (0.3 meters of rise) to extreme (2.5 meters of rise). Along the bottom, a slider lets you set the date. You can animate the map from 2000 to 2100 or pick a specific year. As time passes, locations change color to show how many days each year they’re expected to flood.

The chart on the right lets you explore impacts under each scenario for a selected city. Some places, like Seattle, Washington, see very different outcomes under each scenario later in the century. Others, like Chesapeake Bay Bridge, Virginia, are forecast to see extreme increases in flooding, no matter the scenario.

Map of Washington, centered on Seattle, showing projected increases in high tide flooding days.
By 2100, even cities in the Pacific Northwest are likely to see large increases in daily flooding. (Source: Esri)

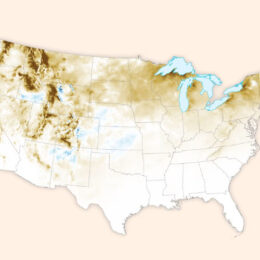
This map makes it easy to compare cities against each other and against themselves over time. At a national scale, every coastal city can expect to see increases in flooding days by 2100. But some places face significantly higher risks. In just the next 10 to 20 years, cities in Texas, Louisiana, Mississippi, New Jersey, Virginia, and New York will see dramatic increases in flooding.

Although this map doesn’t show specific local impacts, it serves as a general warning about the widespread risks of daily flooding. Sea level rise will impact all coastal cities. As this map shows, it’s just a matter of time.

More to Explore

  • Learn more about how this interactive map was made.
  • Take a deeper dive into local sea level rise impacts.

About This Map

Title
US High Tide Flooding Probability Scenarios through 2100
Creator
Esri
Data Sources

NOAA Technical Report NOS CO-OPS 086

Tags
Flooding Interactive Sea Level Rise
Share This Article

Keep Exploring

Concern about global warming is on the rise in the United States

Mapping Climate Anxiety in the US

May 15, 2025
People & Patterns
Climate Change Demographics Disasters
A close-up map of temperature anomalies.

A Climate Message from the 1980s

April 22, 2024
Living Planet
Climate Change Extreme Heat NASA
Map of western United States showing drought intensity from Climate Mapping for Resilience and Adaptation Portal

Which Climate Hazards Threaten Your Community?

October 16, 2023
Living Planet
Climate Change Interactive Resilience
View More Maps
Next Post
A map showing below-average snowfall over much of the United States in early 2024.

A Slow Start to US Snowfall in 2024

February 15, 2024 Living Planet

Maps.com
Explore Today.
Create Tomorrow.
  • About Maps.com
  • Submit a Map
  • Contact
  • Legal
  • Privacy
  • Media Use
  • Manage Cookies
  • Do Not Share My Personal Information
  • Legal
  • Privacy
  • Media Use
  • Manage Cookies
  • Do Not Share My Personal Information
  • Categories
    • Living Planet
    • People & Patterns
    • Natural Wonders
    • Odds & Ends
    • Behind the Map
  • About
  • Submit Map
  • Contact Us
Subscribe

  • Legal
  • Privacy
  • Media Use
  • Manage Cookies
  • Do Not Share My Personal Information

Add New Playlist

  • Categories
    • Living Planet
    • People & Patterns
    • Natural Wonders
    • Odds & Ends
    • Behind the Map
  • About
  • Submit Map
  • Contact Us
Subscribe

  • Legal
  • Privacy
  • Media Use
  • Manage Cookies
  • Do Not Share My Personal Information
US High Tide Flooding Probability Scenarios through 2100

Thank you!

We have received your request and will send updates about Maps.com to your email:

Continue reading article

Sign Up For Updates

Skip to content