In the United States, 2024 is a major election year. From federal races for President, Senate, and the House of Representatives to state and local assemblies, councils, and initiatives, elections are top of mind this year. For campaigns, this means targeting voter turnout efforts in the places where they will have the most impact. And it starts with knowing where eligible voters live.
These interactive maps below from Esri explore the citizen voting age population (CVAP) in two different ways. They rely on data from the US Census Bureau to show where US citizens 18 years of age or older, or potential eligible voters, live.
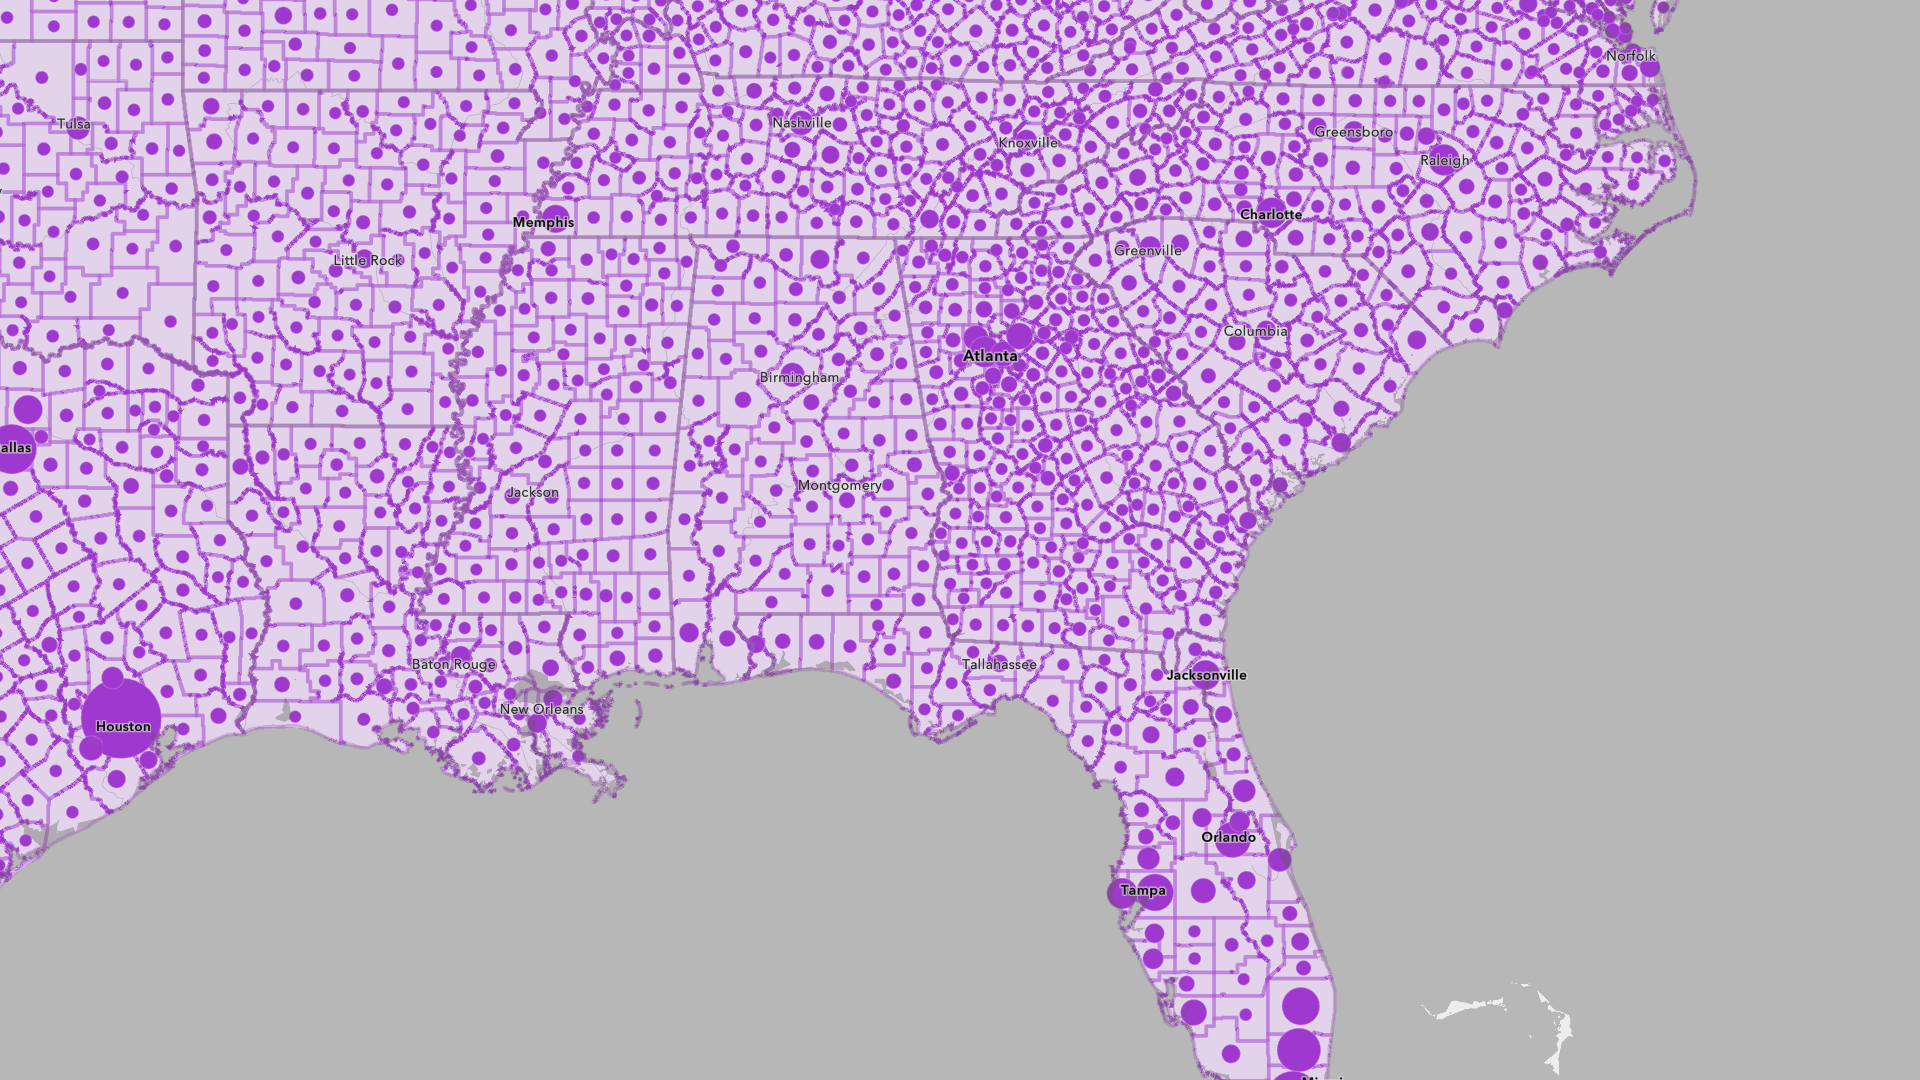
Raw Counts of Eligible Voters
Metropolitan areas such as Houston, Texas, or Atlanta, Georgia, have higher amounts of potential eligible voters. (Source: Esri)
The first map uses proportional symbols to show the total number of CVAP. As a multiscale map, you can zoom in to explore CVAP from the country level to individual block groups. On this map, larger circles represent places with more potential eligible voters. You can click any place for a detailed breakdown of the CVAP by race and ethnicity. The map also includes bookmarks for states that have swung elections in previous cycles.
In this view, major urban areas dominate the map. This is largely what we would expect. If more people live in an area, there is a good chance that area will also have more CVAP. Los Angeles County, California, leads the nation with 2,204,520 US citizens 18 years of age or older.
Citizen Voting Age Population (CVAP) - Viewing App
Explore raw counts of citizen voting age population across the US.
There is utility in this data. But consider that California as a state has a CVAP of more than 26 million people. The US as a whole has just over 238 million potential eligible voters. That means California is home to over 10% of the nation’s eligible voters. To avoid diminishing returns in the most populated areas, campaigns might have more interest in a version of this data that accounts for total population.
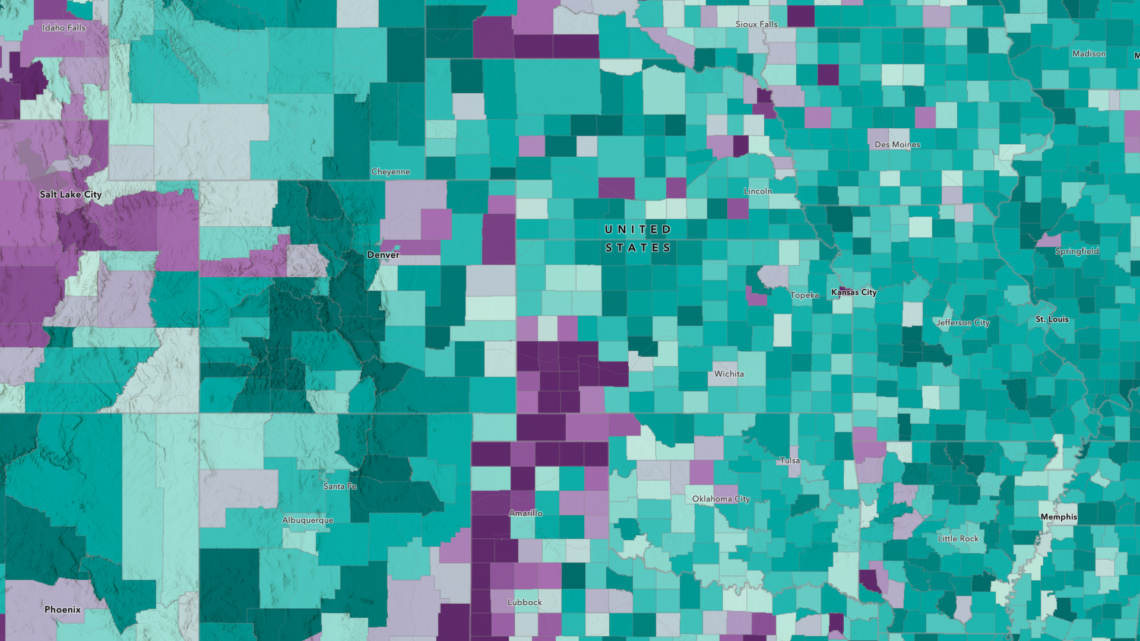
Share of Eligible Voters
Exploring CVAP by share of the total population shows a more nuanced view of potential eligible voters, particularly outside of major metropolitan areas. (Source: Esri)
The second map highlights the percentage of people in a given area that are US citizens 18 years of age or older. Like the previous map, it’s a multiscale map that shows data by country, state, and county. You can still click any place for a detailed breakdown of the CVAP and access bookmarks for every state.
Unlike the previous map, this is a choropleth map. It uses color, instead of symbol size, to represent the data. It’s also normalized by population, showing where pockets of eligible voters make up a larger share of the overall population. Areas in dark green have a higher percentage of potential eligible voters.
This map paints a very different picture of eligible voters. While California has the highest number of total CVAP, it has one of the lowest shares of CVAP by state. Both California and Texas (which also has a lower CVAP share) have higher amounts of people who are not US citizens. For counties with more than 1,000 people, Sumter County, Florida, has the highest share of CVAP at 91%.
This map can help campaigns target clusters of eligible voters within a given state. It can inform efforts around media spends and campaign office locations to community events and door-to-door outreach. And it’s another example of why the census and similar efforts to understand the demographics of American communities are so important.
What Percent of People are in the Citizen Voting Age Population (CVAP) Here? - Sidebar Viewing App
Explore citizen voting age population as a share of overall population.
