• Explore Categories
    • Living Planet
    • People & Patterns
    • Natural Wonders
    • Odds & Ends
    • Behind the Map
Subscribe
Search Form
No Result
View More Search Results

Who Is Threatened by Active Tropical Storms and Hurricanes in the US?

by Robby Deming
September 30, 2024
Living Planet

When a storm like a hurricane is coming, everyone wants to know where it will go. But what they really care about is how it will impact themselves or their loved ones. What if a map could tell us more than where a hurricane will travel? What if it could tell us who will be affected and when?

This interactive map from Esri fuses storm forecasts and demographics. It provides potentially life-saving context at a hyperlocal scale about the people in the storm’s path.

Map showing forecasted hurricane track in the Caribbean with data about wind speed and position Launch Interactive Map
(Source: Esri)

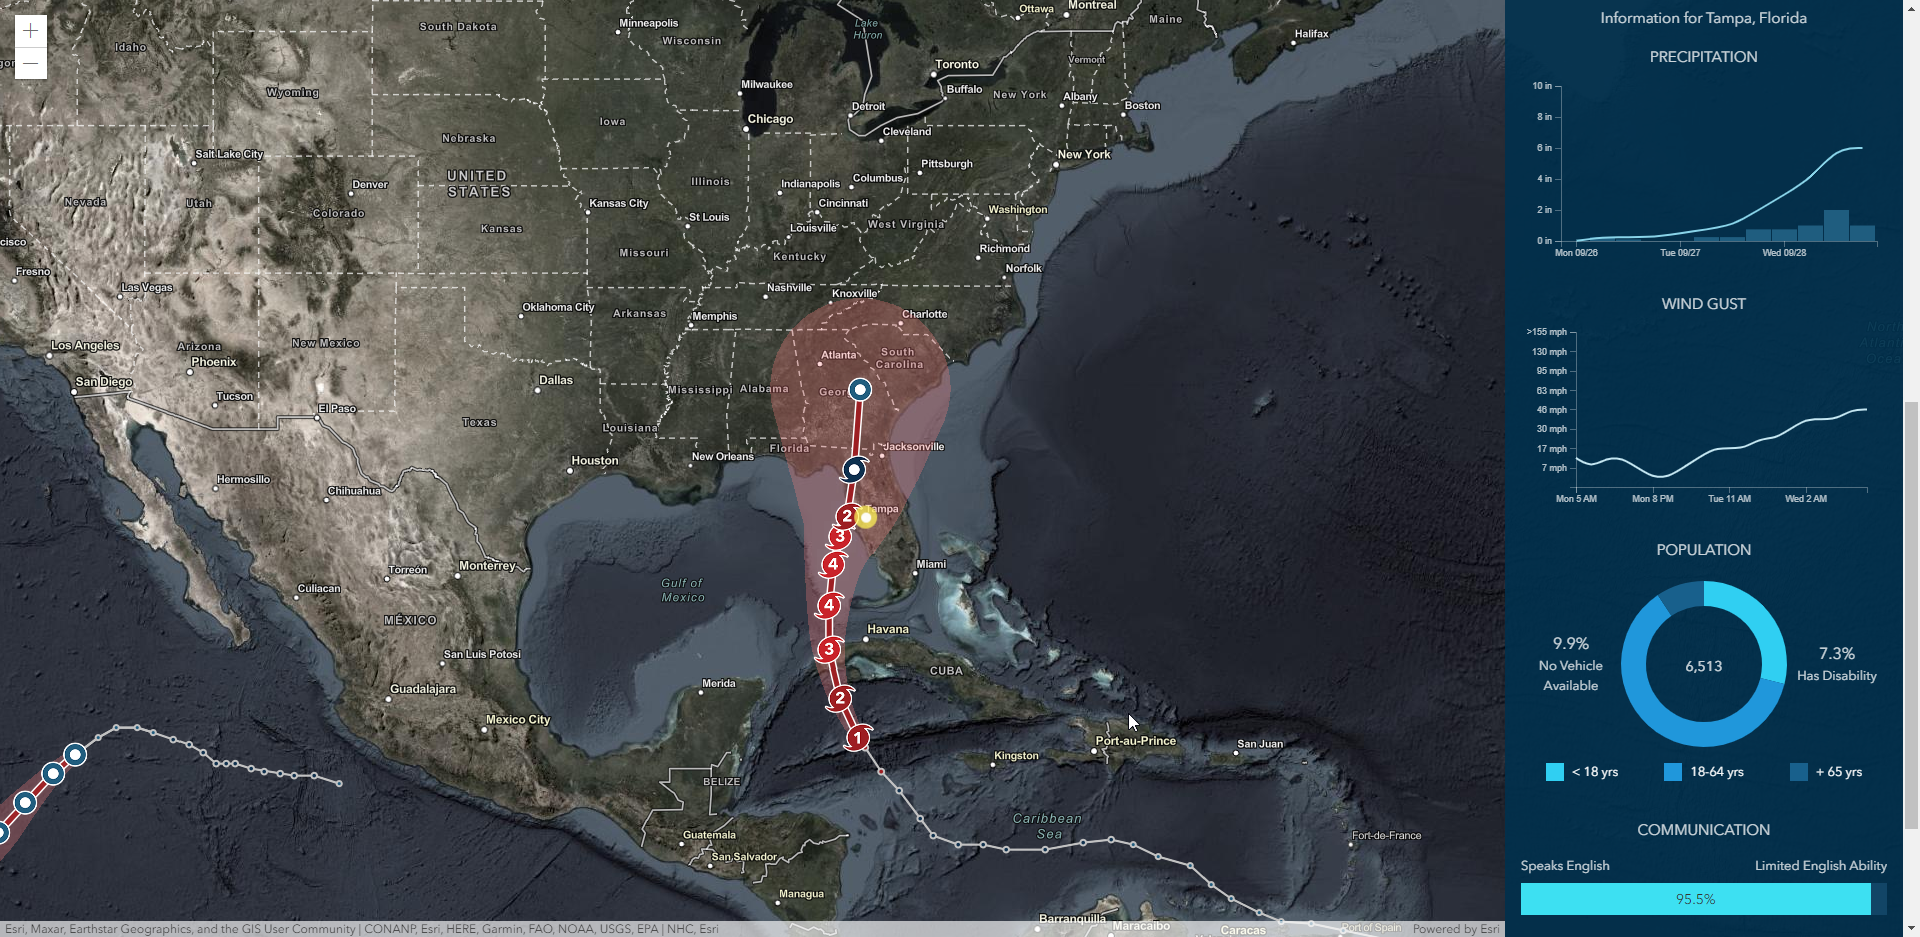
The map includes the essentials of any good hurricane map. You’ll find a 5-day forecast with the track and the cone of uncertainty. Clicking anywhere in the US reveals a suite of hyperlocal data, including the following:

  • 72-hour precipitation forecast showing hourly and accumulated rain
  • 72-hour wind gust forecast
  • Total population
  • Population percentage by age (under 18, 18––64, 65+)
  • Percent with a vehicle
  • Percent with a disability
  • Percent who speak English vs. another language
  • Percent with a cell phone
  • Percent with internet access
 
Map showing hurricanes projected path over southeastern US along with local weather impacts and demographics
Use this map to learn more about the populations in a storm’s path. (Source: Esri)

These insights can inform decisions about when and where people should evacuate. They help emergency managers prioritize vulnerable groups threatened by the storm. And they can even provide context for disaster declarations and recovery efforts.

More to Explore

  • Learn more about how this interactive map was created.

About This Map

Title
Hurricane Aware
Creator
Esri
Data Sources
  • National Oceanic and Atmospheric Administration National Hurricane Center
  • Joint Typhoon Warning Center
  • National Weather Service
  • US Census Bureau American Community Survey
Tags
Demographics Hurricanes Interactive
Share This Article

Keep Exploring

Hurricane Melissa became the strongest tropical cyclone of 2025

Hurricane Melissa Breaks Records

October 31, 2025
Living Planet
Disasters Hurricanes Oceans
A GeoColor satellite composite from August 30, 2024.

How a Map for the Weather Watchers Is Built

October 3, 2024
Living Planet
Animated Maps Disasters Forecasts
Map of the US showing expected annual loss from earthquakes.

Where Do Natural Hazards Cause the Highest Annual Loss in the US?

August 1, 2024
Living Planet
Animated Maps Disasters Hurricanes
View More Maps
Next Post
A GeoColor satellite composite from August 30, 2024.

How a Map for the Weather Watchers Is Built

September 30, 2024 Living Planet

Maps.com
Explore Today.
Create Tomorrow.
  • About Maps.com
  • Submit a Map
  • Contact
  • Legal
  • Privacy
  • Media Use
  • Manage Cookies
  • Do Not Share My Personal Information
  • Legal
  • Privacy
  • Media Use
  • Manage Cookies
  • Do Not Share My Personal Information
  • Categories
    • Living Planet
    • People & Patterns
    • Natural Wonders
    • Odds & Ends
    • Behind the Map
  • About
  • Submit Map
  • Contact Us
Subscribe

  • Legal
  • Privacy
  • Media Use
  • Manage Cookies
  • Do Not Share My Personal Information

Add New Playlist

  • Categories
    • Living Planet
    • People & Patterns
    • Natural Wonders
    • Odds & Ends
    • Behind the Map
  • About
  • Submit Map
  • Contact Us
Subscribe

  • Legal
  • Privacy
  • Media Use
  • Manage Cookies
  • Do Not Share My Personal Information
Hurricane Aware

Thank you!

We have received your request and will send updates about Maps.com to your email:

Continue reading article

Sign Up For Updates

Skip to content